Tephigram
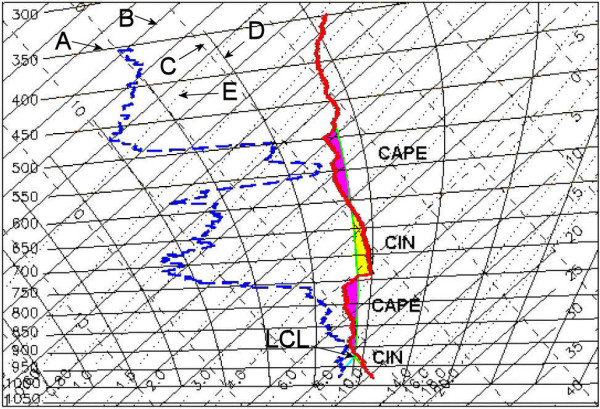
Temperature and humidity data from a Radiosonde ascent plotted in a form known as a tephigram. Grid lines are indicated A-E and are defined as follows: A – Isobars (lines of equal pressure) unit = mbar; B – Isotherms (lines of equal temperature) unit = deg C; C – Dry Adiabat (line of equal dry potential temperature) unit = deg C; D – Wet Adiabat (line of equal saturated potential temperature) unit = deg C; E – Constant saturated mixing ratio unit = g/m3. Temperature is plotted in red, dewpoint temperature in blue. The green plot is a potential temperature curve for a parcel of air being forced to rise from 1000ft. The point on this plot indicated as LCL is the lifting condensation level. The calculated temperature of this parcel of air at any altitude may be read off the plot by looking at points on the potential temperature curve on the temperature axis. Stable and unstable layers are indicated and areas of CAPE and CIN are shaded.