Modelling Studies-Modelling Flux Footprints & Transport Within Forest Canopies
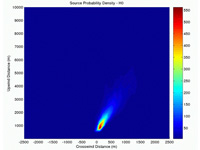
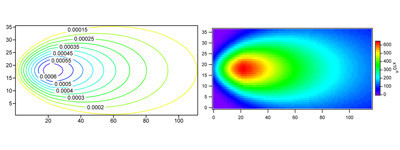
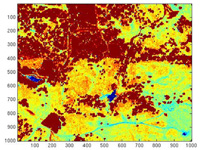
We run a Lagrangian stochastic transport model to simulate the movement of tracer particles through forested structures. This allows us to build footprint estimates for micrometeorological flux measurements made above a forest canopy of emissions of trace gases and particles whose source may be at or below the canopy top. The footprint of a flux measurement, e.g. Figure 1, describes the area of the surface around the measurement location which contributes to what we see. It effectively tells us where the flux is coming from and how to interpret them with respect to the type of soils and vegetation within that footprint and how they respond to variables such as temperature and radiation. This has important implications for the up-scaling of relatively local measurements, and in conjunction with high resolution remote sensing data, Figure 2, allows us to make quantitative statements about the effect of ecosystem structure on observations. The model is computationally intensive, so it normally runs on a volunteer desktop grid, although standalone and MPI versions also exist.
The Volunteer Desktop Grid
Our volunteer desktop grid is a distributed "virtual supercomputer". It runs using software installed on many university computers, and computers belonging to outside volunteers (from Manchester to Australia and many places in between). It uses spare CPU time from computers which would otherwise be idle to run our models. We typically expect several hundred CPUs to be active in the grid at any time, and this number is rapidly growing. For more information on the project, or to use your computer to help us to run our models, visit the website here.
The system uses the Berkeley Open Infrastructure for Network Computing. This is a well tested and secure system which has run for many years at several universities around the world. It is the same system used by SETI, ClimatePrediction.net, the BBC Climate Experiment and many others.
Simpler 2D Models
Simpler 2D models are also available to assist interpretation of field flux measurements over low vegetation or littoral zones.(Link to Coastal Marine Fluxes & Rhamble Project Page).