[University home]

Centre for Atmospheric Science

Urban Ammonia Measurements

Fig 3. This shows the variation of ammonia concentration in a city street location compared with the mass loading of ammonium and nitrate aerosol showing how different sources partition between the gas and aerosol phase as a function of wind direction and distance from source.
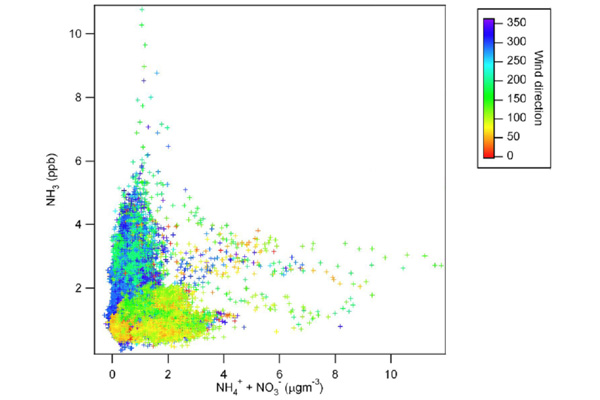
Fig 3. This plot shows the variation of ammonia concentration in a city street location compared with the mass loading of ammonium and nitrate aerosol showing how different sources partition between the gas and aerosol phase as a function of wind direction and distance from source.