[University home]

Centre for Atmospheric Science

Trace Gas Flux Measurements

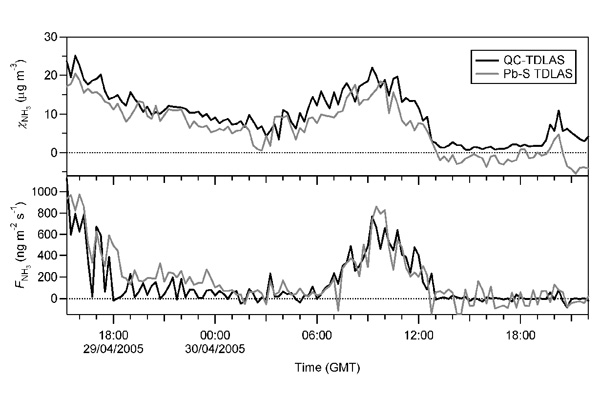
Fig 5. Fluxes of ammonia measured by the eddy covariance technique over a field at CEH Edinburgh undergoing fertilizer application. The graph shows the concentration (top) and flux (bottom) from two different laser absorption spectrometers mounted over the field.