Ammonia Flux Measurements
We currently work on projects such as NitroEurope lead by CEH Edinburgh to look at ways to improve measurements of fluxes of ammonia and nitric acid from both agricultural ecosystems and urban environments. The aim of this work is to improve our knowledge of the amounts of these gases released to and from the atmosphere. This work is often undertaken in conjunction with flux measurements of other species in both urban, rural and forest environments.
80% of the NH3 emissions in the UK is thought to come from agricultural sources but uncertainties in this estimate need to be reduced. Likewise estimates of total emissions of ammonia from vehicles in the UK at 8.9 kT NH3-N yr-1 (uncertainties mean that this value can range from 3.3 to 14.5 kT NH3-N yr-1), Sutton et al. (2000).
The importance of ammonia in urban areas is its role as a precursor for secondary aerosols. It will neutralise acid aerosols such as sulphuric and nitric acids (oxidation products of SO2 and NOx respectively), which are often found in polluted urban air. Ammonia has a short residence time in the atmosphere and will readily undergo these reactions close to the source, contributing to the urban PM concentrations. High PM concentrations have been linked to ill health (Brunekreef and Holgate, 2002) and poor visibility and have implications for global radiation budgets (Horvath, 1992). Furthermore, long-range transport of particles means ammonium can travel beyond the urban environment and be deposited further downwind, with consequences for remote sensitive ecosystems as well as transboundary air pollution (Krupa, 2003).
In the urban environment, sources are numerous and include humans, pets, industry and traffic (Sutton et al., 2000). The largest contributor to urban ammonia emissions is believed to be the transport sector (Dore, 2005). It is partly for this reason, but also for the high uncertainties in the estimates, that Sutton et al. (2000) place this high on a list of research priorities for non-agricultural sources of ammonia. Most previous measurements of ammonia were made with annular denuder systems or passive samplers, with the best time resolution being 10 minutes (Vogt et al., 2005). More recently tuneable diode laser absorption spectroscopy has been used due to its promise of fast time response and potential to be used in micrometeorological eddy covariance systems to measure fluxes of this gas directly.
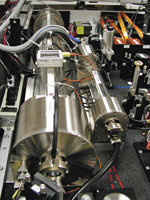
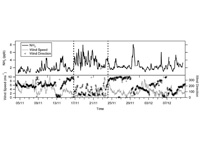
In the group we have adapted an Aerodyne quantum cascade laser absorption spectrometer (QC-LAS) system to atmospheric measure ammonia and nitric acid. We have measured long term concentrations in urban environments to assess contributions from different sources. We also contribute to measurements of fluxes of ammonia from agricultural point sources and ecosystems in experiments lead by CEH Edinburgh to understand the efficiencies of different fertiliser application approaches and how these might affect subsequent emissions. The instrument has also been used to measure emissions from agricultural sources in controlled chamber experiments at CEH.
References
Brunekreef, B. and Holgate, S.T. (2002). Air Pollution and Health. Lancet; 360: 1233-1242.
Dore, C. J., Watterson, J. D., Murrells, T. P., Passant, N. R., Hobson, M. M., Baggott, S. L. et al. (2005). UK emissions of air pollutants 1970 to 2003, National Atmospheric Emissions Inventory. UK: National Environmental Technology Centre.
Horvath, H. (1992). Effects on visibility, weather and climate. In: M. Radojevic, & R. M. Harrison (Eds.), Atmospheric acidity: sources, consequences and abatement, chapter 13. London: Elsevier Applied Science.
Krupa, S. V. (2003). Effects of atmospheric ammonia (NH3) on terrestrial vegetation: A review. Environmental Pollution, 124, 179–221.
Sutton, M.A., Dragosits, U., Tang, Y.S., Fowler, D. (2000). Ammonia emissions from non-agricultural sources in the UK. Atmospheric Environment; 34: 855-869.
Vogt, E., Held, A., & Klemm, O. (2005). Sources and concentrations of gaseous and particulate reduced nitrogen in the city of Münster (Germany). Atmospheric Environment, 38, 7393–7402.