EMERALD Project - CPI Data
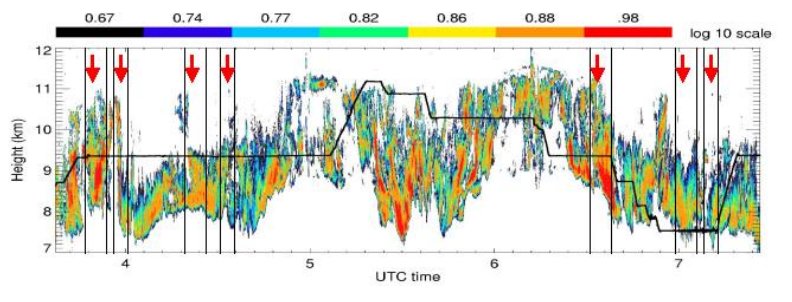
This plot shows the lidar data for one of the flights during the EMERALD1 cirrus project. The scale on the plot is backscatter intensity. The black line superimposed on the lidar data shows the altitude of the Egrett at the same time as the lidar data was taken. The lidar was located on the King Air which was flown beneath the cirrus. The CPI was flown on the Egrett, which during this flight was mostly almost directly above the King Air. Click on the lidar plot to see CPI data for specific regions of the cloud. Regions for which specific data is available for are indicated by the red arrows, all other areas link to the overall data for the flight. Alternatively these pages may be accessed by following the links below:
Region 1 - Updraft, supersaturated with respect to ice.
Region 2 - Downdraft, supersaturated with respect to ice.
Region 3 - Updraft, supersaturated with respect to ice.