Single Particle Soot Photometer
Results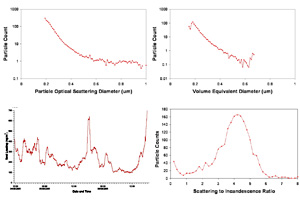
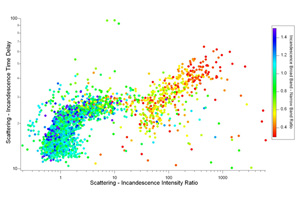
The SP2 has been deployed on five projects to date in locations ranging from central Manchester to Darwin, Australia, and soot particles have been characterised from close to sea level up to an altitude of 14Km. It has also been used in lab experiments at AIDA looking at ice particle nucleation. Some data from its deployment in central Manchester is presented in the following plots. By characterising soot particles in a source region such as a city centre, and then characterising soot particles some distance from this region it is possible to study how these particles evolve in the atmosphere. Additionally the SP2 has been operated on two different CVI inlets to study soot present in liquid and ice particle in cloud.
Since the SP2 is also sensitive to certain metals present in the atmosphere, it is possible to use SP2 data to check for contamination of sample flows caused by the inlet system itself. When aircraft are flown in ice clouds, it has been suggested that ice particles hitting inlets used for aerosol sampling may remove small amounts of inlet material, so contaminating the sample flow. SP2 measurements in Australia on board a relatively slow moving aircraft have shown that this is indeed the case. Material with a boiling point temperature very similar to that of aluminium has been detected only in ice clouds, and not the surrounding air. This suggests that the only possible source of this material is the inlet itself. Similar issues have been identified in measurements made at other locations and with other techniques, which may cast doubt on the validity of previous measurements made using these systems.