ADA Data Figure 1
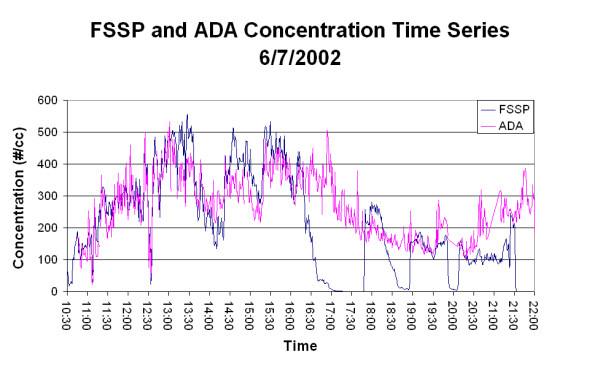
Figure 1A. Comparison between ADA and FSSP droplet number concentration. The figure shows the two instruments to be in good agreement for most of this time period. The drop outs in the FSSP data were due to the FSSP inlet becoming blocked with ice.
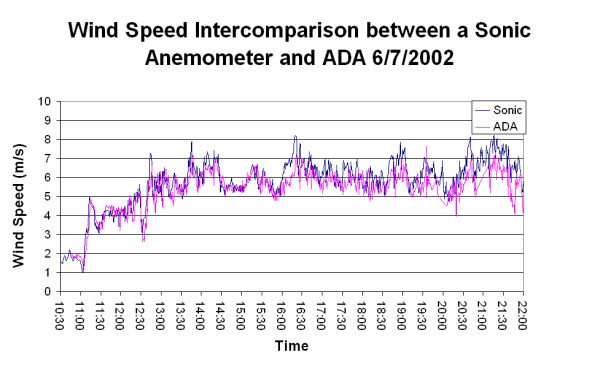
Figure 1B. Comparison between ADA and Sonic Anemometer wind speed. The plot shows the two instruments to be in good agreement. However as the ADA can only measure one component of wind speed this is only the case when the instrument is pointed directly into wind. This also means that the sample volume used in calculating the droplet concentration (above) is only correct when the instrument is pointing into wind.