ADA Data Figure 2
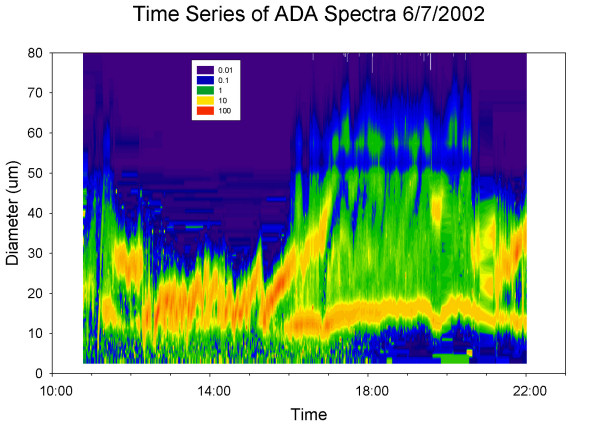
Figure 2A. Time series of ADA size distribution for the same period as the comparisons shown in figure 1
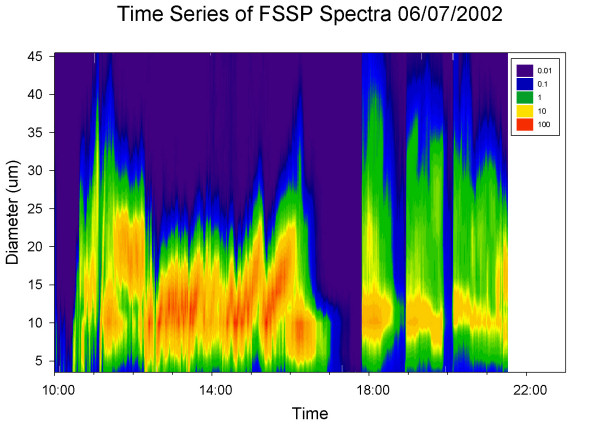
Figure 2B. Time series of FSSP size distribution for the same time period as figure 2A.
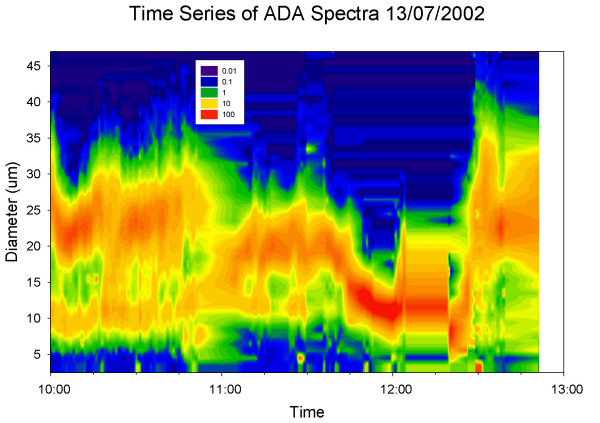
Figure 2C. Time series of ADA size distribution for a different time period.
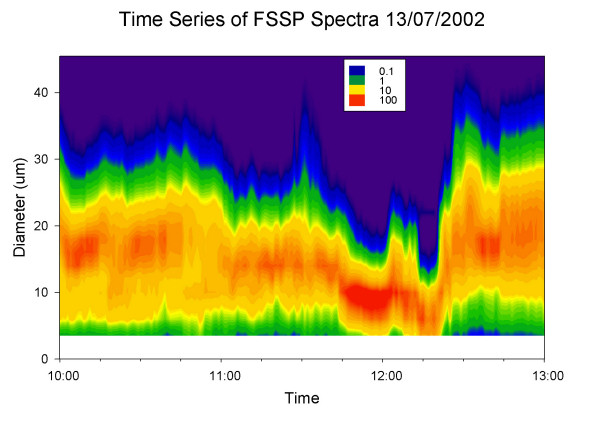
Figure 2D. Time series of FSSP size distribution for the same time period as figure 2C.
These figures illustrate the variation in droplet spectra experienced at the Jungfraujoch. Comparison between the two instruments shows that while trends are similar there are differences in measured droplet size. The higher resolution available with ADA is also apparent, with additional modes in the distribution at smaller sizes being observed more frequently in the ADA data..