Dual QCLAS
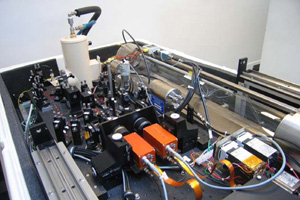
The Dual Quantum Cascade Laser Absorption Spectrometer (QCLAS; figure 1), developed by Aerodyne Research, Inc. (ARI; www.aerodyne.com), makes use of the rich spectral region in the mid-infrared, in which most species of interest in the atmosphere have resolvable absorption features. Ambient air is drawn into a chamber through which infrared laser beams are shone. The laser frequency is scanned across the frequency of the absorption feature of the gas in question in order to map the entire feature.
The dual QCLAS uses two thermoelectrically cooled pulsed Quantum Cascade (QC) lasers (developed by Alpes Lasers, Neuchatel, Switzerland), which provide greater stability and output power than the lead salt diode lasers used in earlier instruments, which required cryogenic cooling. The QC lasers available can be tuned to measure NH3 at 967 cm-1, NO2 at 1606 cm-1, HNO3 and HCHO at 1722 cm-1, and NO at 1909 cm-1. Tuning of the QC lasers is achieved using Peltier controlled coolers capable of setting the temperature between +10°C and –40°C. A typical tuning rate for these QC lasers is 0.1 cm-1 K-1.
The two beams are brought together (with the pulses separated temporally) and directed into either of two astigmatic Herriott multipass absorption cells, in which they pass back and forth up to 238 times, before leaving the cell and arriving at a cryogenically cooled HgCdTe infrared detector. The large (5 litre) cell is able to provide a path length of 210 m, while the small (0.3 litre) cell provides a path length of 56 m. The long path length allows gas concentrations to be measured with greater sensitivity. The measurement precisions of each of the lasers with a signal-to-noise ratio (S/N) of 2.0, are shown in table 1, along with the limits of detection (LOD). The LODs were calculated as LOD = 4 x RMS x t-1/2 with an integration time t of 1 minute at S/N = 2.
| Trace Gas | Frequency cm-1 | Precision ppb RMS Hz-1/2 |
LOD ppt (1 min) |
| NO | 1909 | 0.09 | 45 |
| NO2 | 1606 | 0.03 | 15 |
| NH3 | 967 | 0.035 | 18 |
| HNO3 | 1722 | 0.18(1) | 90(1) |
The cells are operated at between 2.5 and 10 kPa, with flow rates providing evacuation (response) times of 0.4 and 0.05 seconds for the large and small cells, respectively. The small cell provides the fast time response required for eddy covariance flux measurements whilst the larger cell is used for higher precision measurement applications.
In order to discriminate against any unwanted spectral features, including optical fringes, the absorption cell is periodically flushed with zero air (either dry N2 or scrubbed ambient air) by toggling a valve connecting the zero air source to the inlet. After several cell flushing times, the background spectrum is acquired (averaged over a few seconds) and is subtracted from all the signal spectra until the next background. The temperature on the optical table is carefully maintained in order to minimize wavelength drifting of the optical fringes, so the background subtraction may be done relatively infrequently (typically every 15 minutes).
A software package called TDLWintel, developed at ARI, is used for driving the lasers, data acquisition, calculating and analysing all the spectra, and archiving the data. The software generates the voltage ramp needed to sweep the laser frequency across the absorption features, as well as giving the user direct control over the ramp parameters (range in volts, central value, etc.) and laser temperatures. The spectra are recorded and averaged over the data acquisition time, and the software fits the resulting spectra to a template of known spectral line profiles from the HITRAN (HIgh-resolution TRANsmission) molecular spectroscopic database. Absolute trace gas concentrations can then be calculated from the strength of the absorption line measured, the temperature and pressure of the absorption cell and the path length.
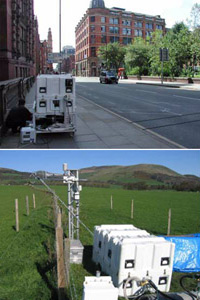
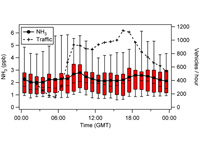
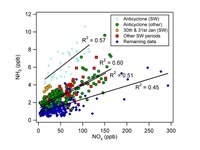
The dual QCLAS has been deployed on a number of experiments in Manchester city centre to measure NH3 concentrations, both at rooftop and street level, and during both winter and summer. The results (shown in figure 3 and 4) show a significant link between NH3 concentrations and traffic, particularly during the winter months, supporting the idea that vehicles are a growing source of NH3 in the urban atmosphere due to more widespread use of catalytic converters. The link is much weaker during the summer, implying that other sources become important in warmer conditions. In one street level experiment, diurnal cycles were also observed in HCHO, suggesting a traffic source, and HNO3, linking it to photochemical production.
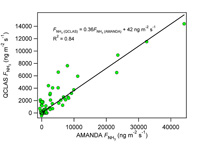
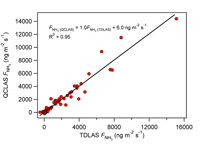
The dual QCLAS has also been developed for flux measurements of NH3. The small absorption cell provides a time resolution of 10 Hz, making it suitable for eddy covariance flux measurements. Two experiments have been conducted in collaboration with Centre for Ecology and Hydrology (CEH) Edinburgh at their grassland site south of Edinburgh. Fluxes were calculated online on a second computer by combining the serial output of the dual QCLAS with the output from an ultrasonic anemometer using software developed by CEH and the University of Manchester. Concentrations and fluxes of NH3 measured with the dual QCLAS correlated well with those measured with a TDLAS (a similar instrument that uses lead salt diode lasers) and an AMANDA (which measures fluxes by the flux gradient technique) when emissions were high following slurry application, these results are shown in figures 5 and 6. However, no correlation could be seen between the fluxes measured by these instruments when the emissions were low, indicating that more work is needed to make accurate EC flux measurements of NH3 with the QCLAS at typical ambient concentrations. The main limiting factor is believed to be the sample tube, and further work will involve testing different materials and designs of inlet, both in the field and in the laboratory.
Figures showing some results from the QCLAS - click the image for a larger version and description
References:
Whitehead, J.D., Longley, I.D., & Gallagher, M.W. (2007) Seasonal and diurnal variation in atmospheric ammonia in an urban environment measured using a quantum cascade laser absorption spectrometer. Water, Air & Soil Pollution DOI 10.1007/s11270-007-9381-5.
Twigg, M., Famulari, D., Fowler, D., Gallagher, M., Nemitz, E., Sutton, M.A., Whitehead, J. & Rippey, B. Principles and development of tunable laser diode absorption spectroscopy for measuring fluxes of ammonia and nitric acid. Proceedings of the First ACCENT Symposium, Urbino, 12-16 Sept. 2005.
McManus, J.B., Nelson, D.D., Shorter, J.H., Zahniser, M.S., Mueller, A., Bonetti, Y., Beck, M., Hofstetter, D. and Faist, J. (2002) Quantum cascade lasers for open- and closed-path measurement of trace gases. in: Fried A. (ed.) Diode lasers and applications in atmospheric sensing, Proc. SPIE 4817, 22-33.
Zahniser, M.S., Nelson, D.D., McManus, B. and Kebabian, P.L. (1995) Measurements of trace gas fluxes using tunable diode laser spectroscopy. Phil. Trans. Roy. Soc. Lond. A 351, 371-381.