The Whitworth Meteorological Observatory - Air Pollution on Bonfire Night 2011
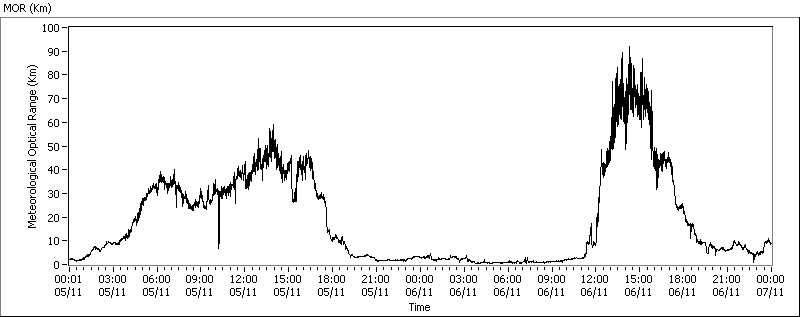
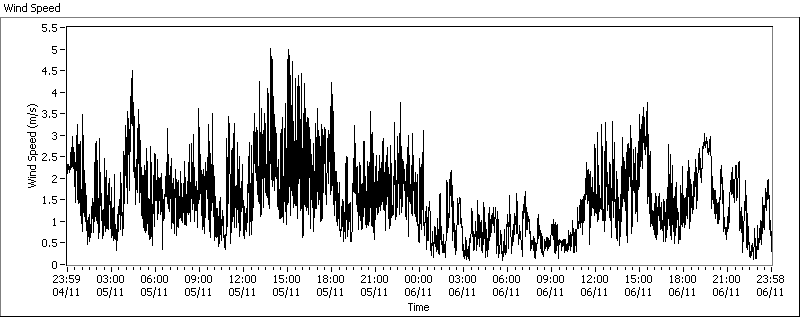
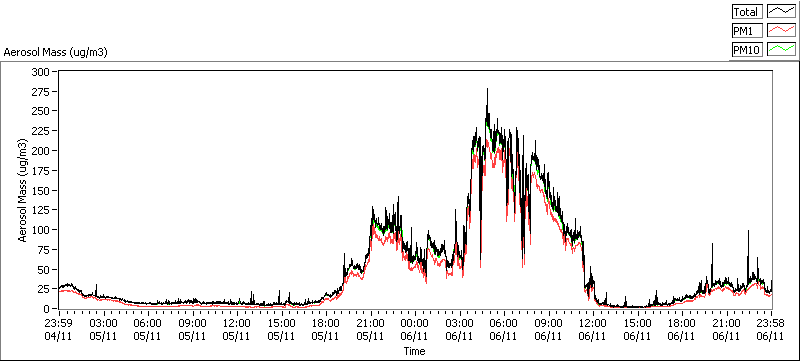
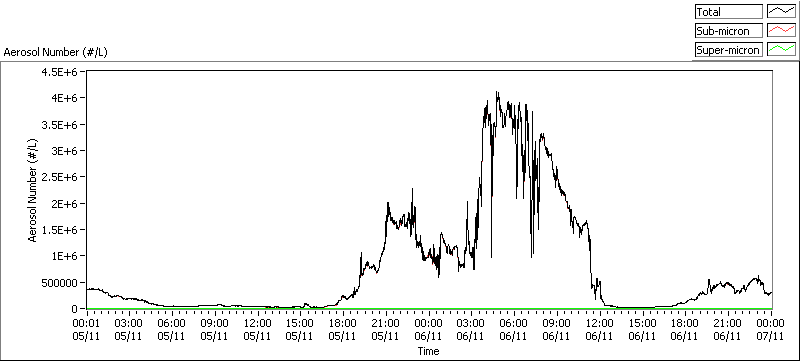
Below are some plots of met and aerosol data from the 5th and 6th November 2011. It can clearly be seen that the clear and calm conditions led to a significant build up of pollution during the evening of the 5th and the early hours of the 6th, with total aerosol loadings in the size range 0.3-20µm peaking at 275µg/m3 and PM1 (the inhalable portion of the aerosol distribution) at least 200µg/m3. It is likely that the true loadings were somewhat higher as the instrument used does not measure particles smaller than 0.3µm. Measurements of black carbon (soot) aerosol also showed exceptionally high values, and visibility was significantly reduced as a result of the pollution. Elevated pollution levels persisted till the wind picked up around 11am on the 6th. Elevated pollution levels were also observed on the evening of the 6th, but to a lesser extent than the previous day.
Wind Speed
Aerosol Mass Loading
Aerosol Number
Black Carbon Mass
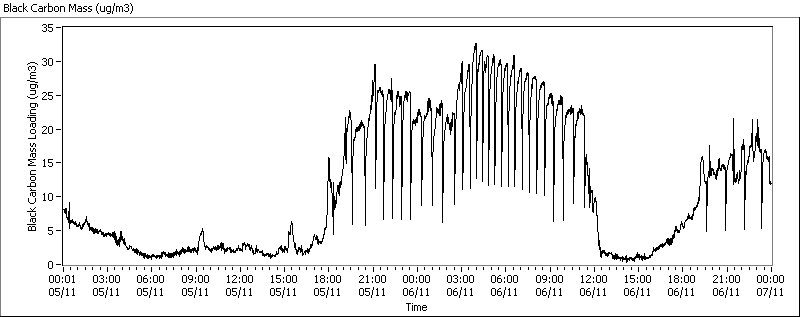
Note that the downward spikes in the data during the period of high pollution levels are an instrument artifact caused by the automatic filter changes carried out by the instrument.
Visibility