Dynamics
In essence, clouds are formed when air is forced to rise, and cools as it does so. Various scenarios in the atmosphere can lead to this situation, including large scale circulations, frontal systems, orographic flow, gust fronts, gravity waves, and lee waves caused by flow over mountains.
The dynamical situation in which cloud is formed is hugely important in determining cloud properties. In warm clouds, the updraft at cloud base determines the peak supersaturation achieved, and hence the number of droplets formed (for a given aerosol distribution). Dynamics are also important in determining what happens after the initial activation event, including how large and how rapidly droplets grow, and whether secondary activation events occur. Similar effects are present within ice clouds.
As well as the dynamics which lead to cloud formation, atmospheric stability is critical in determining how a cloud system will develop. In stable conditions cloud will be present only where air is being forced to rise, but will not develop further. In unstable conditions once air is forced to rise it is able to continue doing so until it reaches a stable layer. Such convective systems generate considerable amounts of lightning and precipitation. Stability is defined by the temperature and humidity profile of the atmosphere. If a parcel of air is forced to rise, it cools adiabatically, if at its new height its temperature is lower than that of the surrounding air it will be denser and experience a force which tends to return it to its original position. This is what occurs in stable conditions. If however, the parcel of air is warmer and so less dense than the surrounding air, it has positive buoyancy and experiences a force which tends to displace it further from its original position. This is what occurs in unstable conditions. When rising air cools sufficiently that it becomes saturated water begins to condense out. The level at which this occurs is referred to as the lifting condensation level (LCL) and is approximately equivalent with cloud base. The latent heat released during formation of cloud drops and ice particles slows the fall in temperature as the air rises, thus giving the cloud additional buoyancy. When considering atmospheric stability the dry adiabatic lapse rate is used below the LCL and the saturated lapse rate above. If the calculated temperature of a parcel of air forced to rise from a given level is above the actual temperature profile of the atmosphere, then conditions are unstable, if it is below the actual temperature profile then conditions are stable. Unstable conditions are often caused by heating of air in the lower levels of the atmosphere. In unstable conditions convection only stops when a stable layer is reached and the rising air has neutral buoyancy, in some cases this is not until it reached the tropopause where temperature begins to increase with altitude. The momentum of a parcel of rising air causes it to overshoot the level at which it is neutrally buoyant before it then subsides back to this level.
When considering atmospheric stability, temperature and dewpoint temperature (the temperature at which condensation begins to occur) are plotted as a function of atmospheric pressure on a diagram known as a tephigram. Such a plot has a grid of isotherms (lines of constant temperature), isobars (lines of constant pressure), wet and dry adiabats (lines of constant potential temperature), and lines of constant saturation mixing ratio. Such a plot with these lines labelled is shown in the figure below. Dry potential temperature is defined as the temperature a parcel of air would have if it were expanded or compressed adiabatically (i.e. with no energy added to or lost from the parcel) from its current pressure to a pressure of 1013.25mbar. Saturated potential temperature is defined in a similar manner, but takes into account latent heat associated with condensation / evaporation.
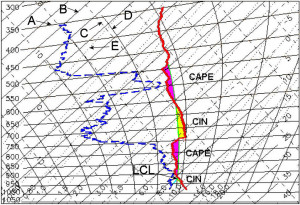
When using a tephigram to consider whether convection will develop three additional lines are plotted. Two of these start from the actual temperature and dewpoint temperature of air close to the surface (or at the level at which a forced lifting is thought to occur) along the dry adiabat and constant saturation mixing ratio lines respectively. When these lines intersect this indicates that the LCL has been reached. From that point onwards a third line is plotted along the wet adiabat corresponding to the LCL. Regions where this plotted potential temperature curve is to the right of the profile temperature (i.e. warmer) conditions are unstable and where it is to the left (i.e. cooler) conditions are stable. The area between the potential temperature and profile temperature curves indicates the energy available to drive or inhibit convection. In stable conditions this is known as the Convective Inhibition (CIN) and in unstable conditions as Convective Available Potential Energy (CAPE). Where a stable layer occurs over an unstable area, the height at which CIN and CAPE are equal indicates the maximum level to which convection may penetrate (ignoring frictional losses).
Additionally as a cloud system develops air from around the system may be mixed (entrained) into the system. The moisture content of this air is critical in determining the development of the system. Entrainment of air from a dry layer may cause the air to no longer be saturated which will start to cause evaporation, and may inhibit the development of the system even in otherwise unstable conditions.