The occurrence of strong winds in the lower troposphere
Each year the UK experiences a number of storms with a few of these events containing particularly damaging winds. Studies have shown that in those events exhibiting the strongest winds the origin of these winds, in some cases, has been from wind features above the boundary layer. These include dry intrusions extending down to the surface, "cold-conveyor belts" and "Sting Jets". However, not all winds within this region descend to the surface and so mechanisms that enable these winds to descend to the surface (such as convective mixing) must also be considered. A climatology of winds in this region of the atmosphere should give further insight to the nature of these features and an indication of their number, severity and role in events with strong surface winds..
The Mesosphere-Stratosphere-Troposphere (MST) VHF radar , located near Aberystwyth, mid Wales, has been running quasi-continuously since 1996, providing a data set of winds passing over this location with high temporal and vertical resolutions (on the order of 6 minute and 300m respectively). Using this data set a study is possible of strong winds within the lower troposphere with the goal of sourcing those events which may result in extreme wind events at the surface. The MST data set will provide a climatology of these events, while its wider importance can be realized through comparisons with other instruments such as radiosondes, rain radar, satellite imagery and the FGAM's mobile UHF 1290 MHz radar.
Case studies of particular events captured by the MST radar (and other instruments) provide particular insight into the smaller scale features of these events, which may be missed by other methods alone (such as radiosonde ascents). One such case study is that of the 27th October 2002 windstorm "Jeanette" that passed over not only the MST site but also that of the FGAM instrument, deployed at that time in Cardington, Bedfordshire.
27th October 2002: Windstorm "Jeanette"

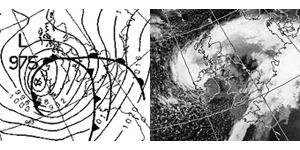
On the 27th October 2002 the UK experienced strong winds (in excess of 45 ms-1) as a well developed frontal system, (see figure 1) passed across the UK.
The passage of the storm was such that it passed over the MST site near Aberystywth (52.42N, 4.01W) and the UFAM mobile wind profiler deployed at Cardington, Bedforshire (52.06N, 0.25W).
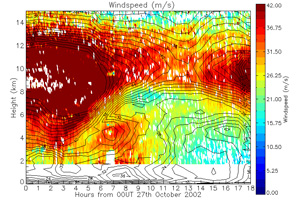
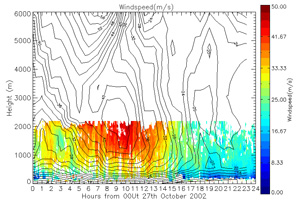
These two wind profilers observed periods of winds in excess of 35 ms-1, which, when related to satellite imagery and Nimrod rain radar data, showed strong spatial relationship to the system's characteristic cloud head. (see figure 2 and figure 3). The MST observed a wind maximum between 3.5 and 5 km from 05 UT - 09 UT, while the FGAM instrument observed, from 10UT through to 13UT, a wind maximum centred around 2km, extending at down surfacewards at times.
Subsequent comparisons with the UK Met Office's Unified Model indicate that the system had a strong cold conveyor belt beneath the cloud head, that lead to convection within the boundary layer, which mixed strong winds down to the surface. In addition there was a wind feature, separate from the CCB, that descended from within the system's cloud head and continue ahead of the cloud head, bearing characteristics of a Sting Jet like feature. However, the operational Mesoscale model does not have sufficient resolution to be able to clearly depict this feature, but a high-vertical resolution version does give further insights.Data from the both the operational version of the UK Met Office's Unified Model and a version with high vertical resolution and extended horizontal domain area are being used to further study the origin and nature of these strong low level winds.
For further information about this research, contact Geraint.Vaughan@manchester.ac.uk
References:
G. A. Parton, G. Vaughan, E. G. Norton, K. A. Browning and P. A. Clark. Wind profiler observations of a sting jet. Quart. J. Roy. Meteorol. Soc. 135, 663-680, 2009.
G. A. Parton, A. Dore and G. Vaughan. A climatology of mid-tropospheric mesoscale strong wind events as observed by the MST Radar, Aberystwyth. Met. Apps. 17, 340-354, DOI: 10.1002/met.203, 2010.

Figure 2 - MST windspeeds for 00 - 18UT, 27th October 2002 with windspeeds from the mesoscale version of the Uk Met Office Unified Model overlayed.
