Holme Moss PROCLOUD Results

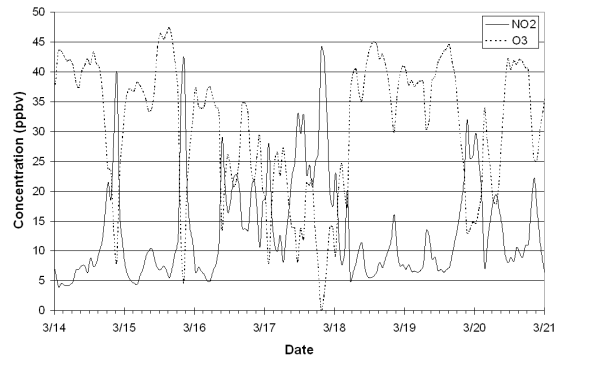
Figure 2. Anti-correlation between O3 and NO2, resulting from chemistry between O3 and NO, thus showing that most of the NOx measured is emitted as NO. Note also the diurnal cycle in NO2 concentration, at least part of which may be related to traffic flow in the city. The late evening peak is not thought to be related to traffic flow.