[University home]

Centre for Atmospheric Science

Single Particle Soot Photometer

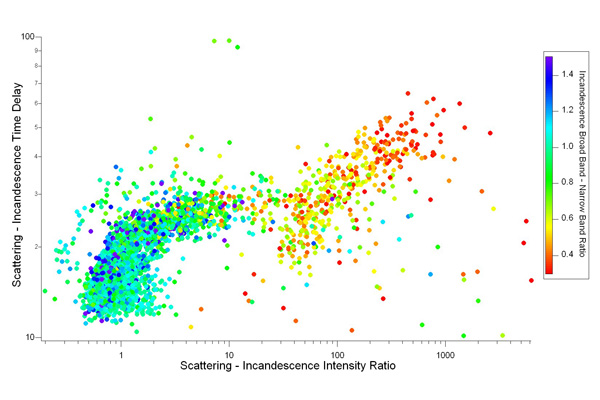
Scatter plot of single particle SP2 data, plotting scattering to incandescence time delay against scattering to incandescence intensity ratio. Points are coloured according to broad band to narrow band incandescence intensity ratio which represents boiling point temperature. This type of plot shows up two distributions from particles of different composition very clearly. Here the points coloured green - blue have a boiling point temperature characteristic of black carbon, those coloured red - orange have a much lower boiling point temperature.